
Single Stock Fundamental Breakdown
Single Stock Fundamental Breakdown
I’ll fill out my fundamental analysis template for any stock so you can see the numbers clearly and make your own decision—no financial advice or recommendations included. This is a one-time snapshot delivered in ~2 days, with updates available only through a new purchase.
You will also receive a one paragraph summary of the analysis.
Example:
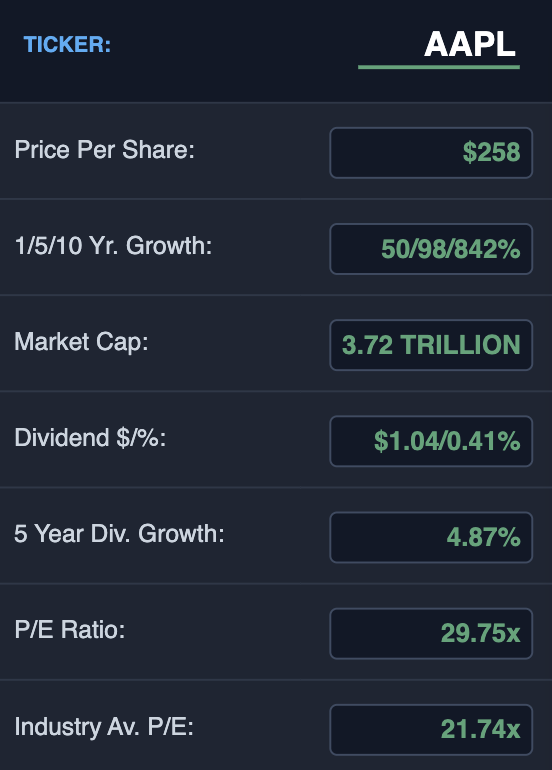
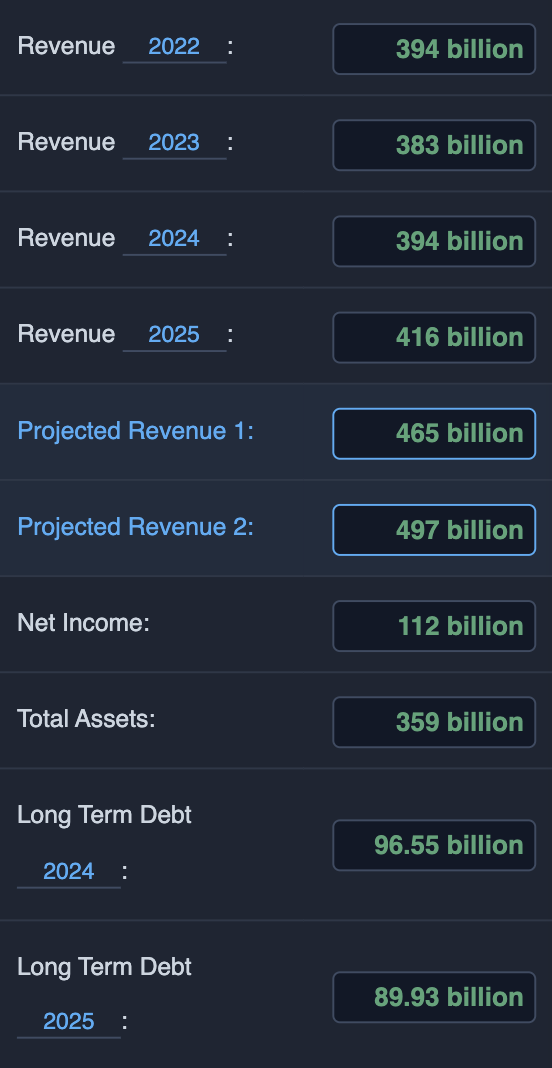
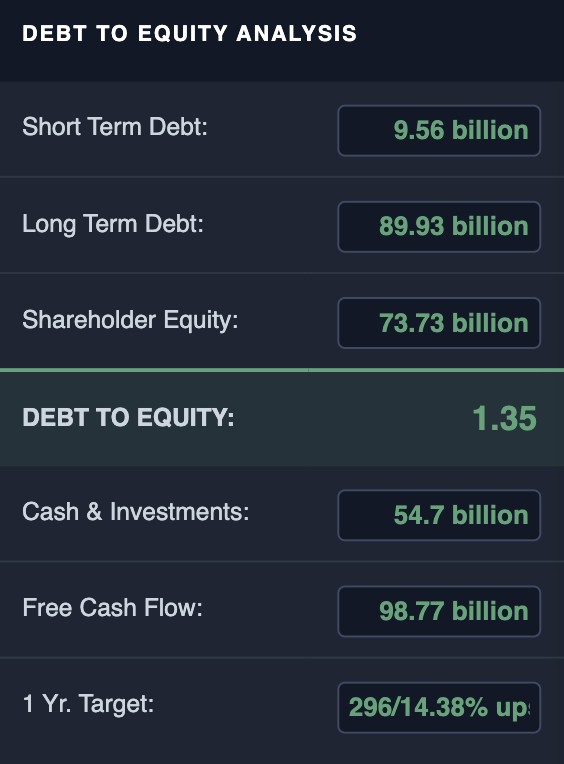
You asked me to review AAPL. Apple has a massive 3.72 trillion dollar market cap. The PE ratio is slightly above the industry average, but some investors might be willing to pay more due to the belief that Apple will continue to provide massive growth. And while AAPL has shown strong long term growth (842% over 10 years) and consistent net income of $112 billion, there is some tightening. Total assets have dipped 1.57% since 2024. Their cash and other investments have seen a notable 16% decline. And Free Cash Flow remains very strong, despite being down 9.23% since 2024. Apple’s debt to equity ratio is 1.35. Pretty good. Despite some contractions in liquidity and assets, analysts are still optimistic - seeing a 14.38% potential upside with a 1 year price target of $296.
Please include your name, email, and the stock ticker symbol you would like me to analyze for you. Once the template is filled out, I’ll email it to you.