
Side by Side Fundamental Analysis
Side by Side Fundamental Analysis
I’ll fill out my fundamental analysis template for any TWO STOCKS so you can see the numbers clearly and make your own decision—no financial advice or recommendations included. This is a one-time snapshot delivered in ~2 days, with updates available only through a new purchase.
You will also receive a 3 paragraph summary of the stock analysis.
Example:
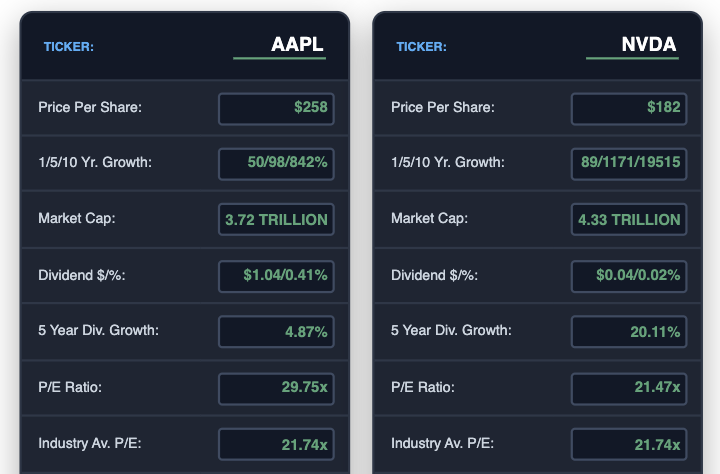
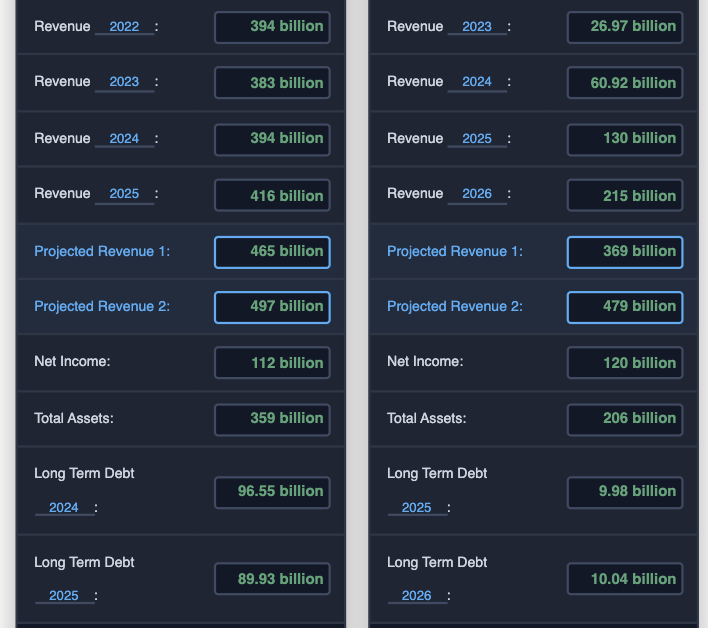
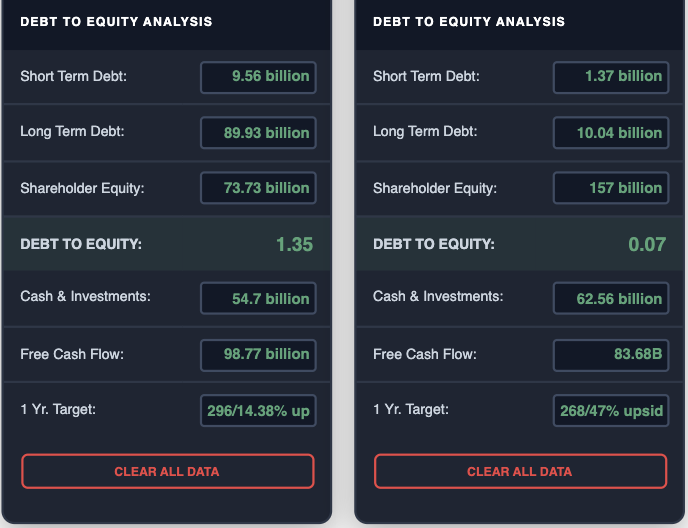
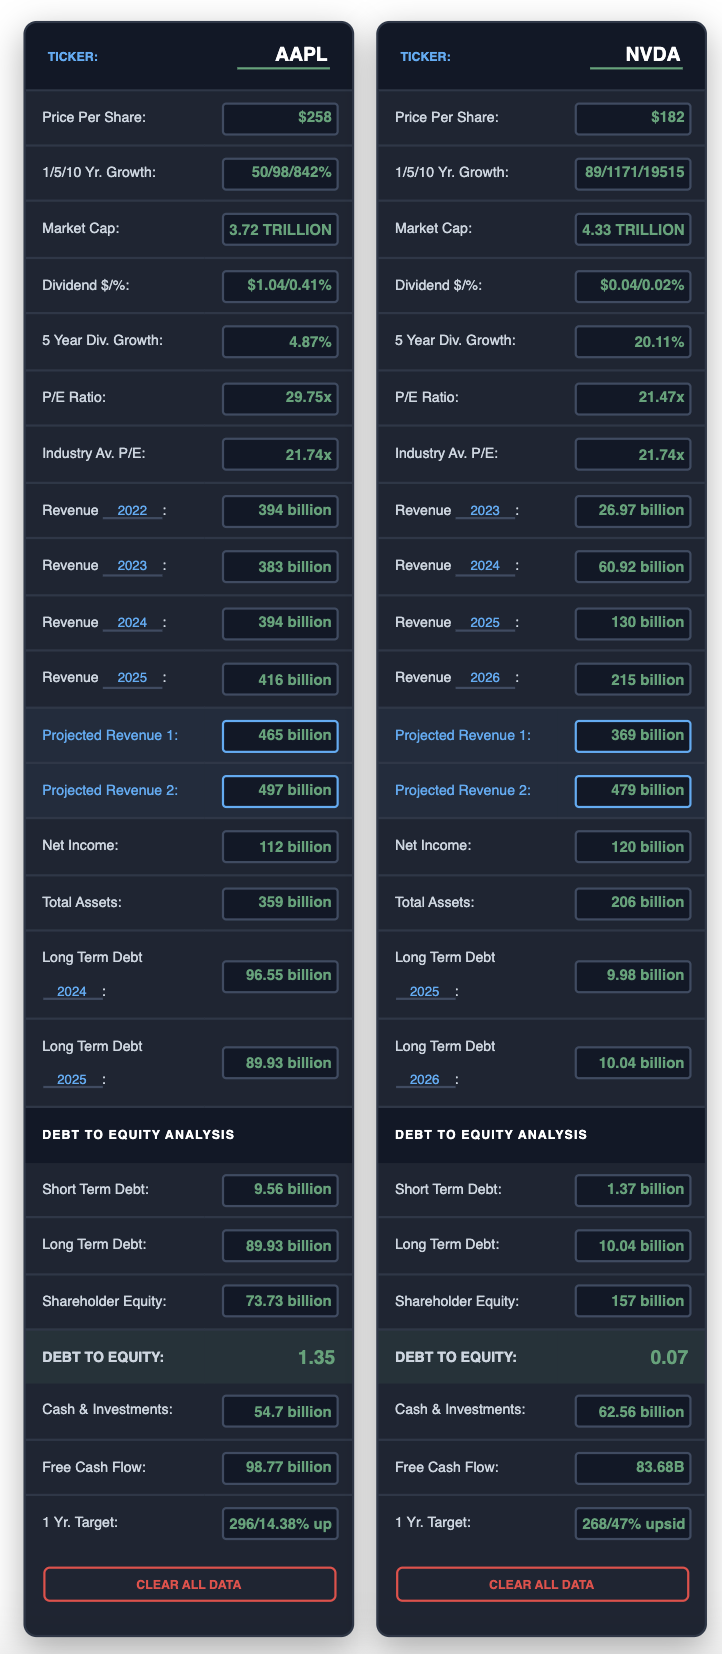
You asked me to review AAPL. Apple has a massive 3.72 trillion dollar market cap. The PE ratio is slightly above the industry average, but some investors might be willing to pay more due to the belief that Apple will continue to provide massive growth. And while AAPL has shown strong long term growth (842% over 10 years) and consistent net income of $112 billion, there is some tightening. Total assets have dipped 1.57% since 2024. Their cash and other investments have seen a notable 16% decline. And Free Cash Flow remains very strong, despite being down 9.23% since 2024. Apple’s debt to equity ratio is 1.35. Pretty good. Despite some contractions in liquidity and assets, analysts are still optimistic - seeing a 14.38% potential upside with a 1 year price target of $296.
On the other hand, NVDA has a market cap of 4.33 trillion and is in a massive expansion phase. This stock has already experienced massive, explosive momentum, going up 19,515% in 10 years. Their P/E ratio is perfectly aligned with the industry average. Their revenue growth is astonishing, jumping from 26 billion in 2023 to a projected 479 billion in 2026. NVDA is super lean - their debt to equity ratio is just 0.07 (Bond, James Bond). Their net income is 120 billion (up 64% from 2025). Cash and investments are up 44% from 2025. Free cash flow is up 37.51% from 2025. Analysts see the stock going up 47% in the next 12 months to hit their target price of $268.
When comparing these two titans, the divergence in momentum is clear. While Apple remains a cash-flow powerhouse, it is currently in a 'tightening' phase, showing slight contractions in assets and cash reserves as it matures. On the other hand, NVIDIA is operating with unprecedented efficiency; it is not only outscaling Apple in net income growth but doing so with a James Bond debt-to-equity ratio (0.07) that makes it significantly leaner. For an investor, the choice comes down to Apple’s stability versus NVIDIA’s hyper-growth, though the balance sheet currently signals that NVIDIA has more 'dry powder' and aggressive tailwinds for the year ahead.
Please include your name, email, and the stock ticker symbols you would like me to analyze for you. Once the template is filled out, I’ll email it to you.